Since the main work inspiring this site,
we got many feedbacks and tens of uploads which allowed us to expand the view on the result already achieved:
Cy0 is still the first method in Real-time PCR analysis that does not require the
assumption of equal efficiency between unknowns and standard curve.
As shown, the Cy0 method
and the Gold Standard Ct (and others) were equally precise and accurate in optimal amplification conditions, while,
when PCR efficiency was decreases, diluting
amplification mix quantity or adding a biological inhibitor such as IgG, the Cy0 method
gave significantly more accurate and precise quantification.
To have a look to a wider and deeper analysis regarding the reliability of Cy0 see
Evaluation of qPCR curve analysis methods for reliable biomarker discovery: Bias, resolution, precision, and implications (FREE for Cy0method.org subscribers
only under kind permission of Elsevier Limited - license #3036951067977)
(p.s. Thanks to dr Jan M. Ruijter for involving our project in his evaluation of qPCR curve analysis methods).
Moreover, the analysis of the data collected through this site, has given us the cue
to find a path leading to a quantification method able to provide a valid result
almost in every (suboptimal) amplification condition.
In this sense, every global model we dealed with, has shown fitting problems in
particular shaped amplification curves, i.e. when the flex point is too close to the
X-axis, or as well, dealing with Taqman chemistry curves, either Sybr Green.
At last, we would like to take this opportunity, to thank the hundred and more
subscribers that with their interest have allowed our project to achieve this new result.
Sincerely, The Cy0 Team
Dear Cy0 team,
Here is a comparison of the variability with triplicate measurements with the same cDNA using 12 different probes
mean SD (n=21) with SD from mean SD:
Cy0 mean of STD 1.36 +/- 0.70 %
Ct from instrument 1.64 +/ 0.93%
Cy0 expressed as as 2^-Cy0 28.3 +/- 16.7%
N0 from linear regression 38.7 +/- 32.65%
That indicates a clear advantage of Cy0 over the linear regression method by JM Ruijter.
Ulrich Hopfer M.D.
Ph.D. Professor Emeritus Department of Physiology&Biophysics
Case Western Reserve University School of Medicine Robbins Bldg
Euclid Ave. Cleveland OH, United States, June 06, 2014
"I have been evaluating the Cy0 in a qPCR assay to
determine copy number variation in genomic DNA, using
TAQMAN (FAM/VIC) chemistry. I estimated the Cy0, using
the R qpcR library, from a 5 parameter log-logistic model
fitted to the deltaRn values (automatic baseline, ABI 7300).
In over 450 samples, I haven\'t
identified any apparent
sample quality problems, but have observed occasional,
sporadic FAM automatic baselining problems. Importantly,
the Cy0 method is relatively insenstive (but not completely
invariant) to these baselining issues in terms of CN assignment,
whereas the recommended Ct (0.2 threshold) gives rubbish results.
In all other samples, the Ct and Cy0 have given identical, discrete,
high confidence CN calls."
Sue Lester, Australia 25/03/2011
Dear Cy0-team,
thanks for the chance to use your method for PCR-quantification.
I came across your method, when looking for other ways f
or QPCR than using Linreg, realtime PCR-miner, DART and other programs,
which claim to give efficiency values for correction.
Now, in my hands all these methods give widely differing results
and all have much greater variance for replicates than the good old delta Ct-method.
Now, even though I do not understand all the maths in your procedure,
it performs at least as well (or even better) as the delta Ct-method..."
Thanks agains, and I will continue to submit data.
Sincerely, Matthias
Dr. Matthias Kirsch - Univ. Freiburg,
Institut für Anatomie & Zellbiologie
Abteilung Neuroanatomie
Zentrum f. Neurowissenschaften, ZfN.
Freiburg, Germany 2/3/2011
Dear Cy0-team, I noticed thar Cy0 method were more precise than the Ct method,
a 5 % difference in some results (i.e: RSD (%) of 8,8 to Cy0 against
14,4 to Ct). But this was only true to sample with sufficient DNA sample.
I had some assays with low DNA samples that Ct got better results. I figure
it was the lack of Data to estimate Fmax, that distort the Cy0 values.
My experiments were design with a Full factorial Design (2^3),
and I noticed that i had a greater resolution using Cy0 results.
I work with a system to extract Adenovirus, and used PCRq to analyse my results.
Thank you for your help. I hope this info were of any help.
João Vitor Dutra Molino
Faculdade de Ciências Farmacêuticas - USP
Cidade Universitária São Paulo - Brazil 10/3/2012
Dear Cy0 team,
“Thanks for the quick results. I would like to have to following comments on the
results. 1. By using the Cy values for plotting the standard curve, the R square values
are generally increased (e.g. 0.9985->0.9995, 0.9972->0.9975, 0.9931->0.9996,
0.9995->0.9996 and 0.9978->0.9995; Ct value from ABI SDS 2.4-> Cy). 2. The reading between the technical replicates are closer, i.e. lower SD.”
Raymond WK CHEUNG
Department of Medicine and Therapeutics
Li Ka Shing Medical Sciences Building
Prince of Wales Hospital
Shatin, N.T. - Hong Kong S.A.R.
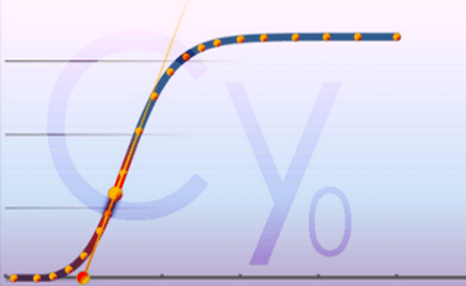
Cy0 is a new method in Real-time PCR analysis that does not require the
assumption of equal efficiency between unknowns and standard curve.
Our method demonstrates that, in optimal amplification conditions, The Ct,
second derivative (Cp), sigmoidal curve fitting method (SCF) and Cy0 methods methods are
equally precise and accurate. However, when PCR efficiency was decreased, diluting
amplification mix quantity or adding a biological inhibitor such as IgG, the SCF, Ct and
Cp methods were markedly impaired while the Cy0 method gave significantly more accurate
and precise quantification (
See example chart).
Publication Abstract
Background:Real-time PCR analysis is a sensitive DNA quantification technique that has recently
gained considerable attention in biotechnology, microbiology and molecular diagnostics. Although,
the cycle-threshold (Ct) method is the present "gold standard", it is far from being a standard assay.
Uniform reaction efficiency among samples is the most important assumption of this method.
Nevertheless, some authors have reported that it may not be correct and a slight PCR efficiency
decrease of about 4% could result in an error of up to 400% using the Ct method. This reaction
efficiency decrease may be caused by inhibiting agents used during nucleic acid extraction or
copurified from the biological sample.
We propose a new method (Cy0) that does not require the assumption of equal reaction efficiency
between unknowns and standard curve.
Results: The Cy0 method is based on the fit of Richards' equation to real-time PCR data by
nonlinear regression in order to obtain the best fit estimators of reaction parameters.
Subsequently, these parameters were used to calculate the Cy0 value that minimizes the
dependence of its value on PCR kinetic.
The Ct, second derivative (Cp), sigmoidal curve fitting method (SCF) and Cy0 methods were
compared using two criteria: precision and accuracy. Our results demonstrated that, in optimal
amplification conditions, these four methods are equally precise and accurate. However, when PCR
efficiency was slightly decreased, diluting amplification mix quantity or adding a biological inhibitor
such as IgG, the SCF, Ct and Cp methods were markedly impaired while the Cy0 method gave
significantly more accurate and precise results.
Conclusion: Our results demonstrate that Cy0 represents a significant improvement over the
standard methods for obtaining a reliable and precise nucleic acid quantification even in sub-optimal
amplification conditions overcoming the underestimation caused by the presence of some PCR.
Hello,
You are the
Warning: mysqli_connect(): (HY000/1045): Access denied for user 'cymethod_2022'@'localhost' (using password: YES) in /home/cymethod/domains/cy0method.org/public_html/functions/db.php on line 62
Warning: mysqli_query() expects parameter 1 to be mysqli, boolean given in /home/cymethod/domains/cy0method.org/public_html/functions/contatore.php on line 140
Warning: mysqli_fetch_row() expects parameter 1 to be mysqli_result, null given in /home/cymethod/domains/cy0method.org/public_html/functions/contatore.php on line 140 visitor, Thanks.
Warning: mysqli_connect(): (HY000/1045): Access denied for user 'cymethod_2022'@'localhost' (using password: YES) in /home/cymethod/domains/cy0method.org/public_html/functions/db.php on line 62
Warning: mysqli_query() expects parameter 1 to be mysqli, boolean given in /home/cymethod/domains/cy0method.org/public_html/navigation/visits_arrays.php on line 9
Warning: mysqli_fetch_array() expects parameter 1 to be mysqli_result, null given in /home/cymethod/domains/cy0method.org/public_html/navigation/visits_arrays.php on line 12
Notice: Undefined variable: visite in /home/cymethod/domains/cy0method.org/public_html/navigation/visits_arrays.php on line 71
Warning: count(): Parameter must be an array or an object that implements Countable in /home/cymethod/domains/cy0method.org/public_html/navigation/visits_arrays.php on line 41
Visiting us from ...
Warning: mysqli_real_escape_string() expects parameter 1 to be mysqli, boolean given in /home/cymethod/domains/cy0method.org/public_html/navigation/last_5_clicks.php on line 43
Notice: Only variables should be passed by reference in /home/cymethod/domains/cy0method.org/public_html/navigation/last_5_clicks.php on line 44
Warning: mysqli_query() expects parameter 1 to be mysqli, boolean given in /home/cymethod/domains/cy0method.org/public_html/navigation/last_5_clicks.php on line 65
Warning: mysqli_num_rows() expects parameter 1 to be mysqli_result, null given in /home/cymethod/domains/cy0method.org/public_html/navigation/last_5_clicks.php on line 66
Warning: mysqli_fetch_assoc() expects parameter 1 to be mysqli_result, null given in /home/cymethod/domains/cy0method.org/public_html/navigation/last_5_clicks.php on line 68
Warning: mysqli_query() expects parameter 1 to be mysqli, boolean given in /home/cymethod/domains/cy0method.org/public_html/navigation/last_5_clicks.php on line 85
Warning: mysqli_num_rows() expects parameter 1 to be mysqli_result, null given in /home/cymethod/domains/cy0method.org/public_html/navigation/last_5_clicks.php on line 86
latest clicks ...
Warning: mysqli_query() expects parameter 1 to be mysqli, boolean given in /home/cymethod/domains/cy0method.org/public_html/navigation/last_5_clicks.php on line 150
Warning: mysqli_num_rows() expects parameter 1 to be mysqli_result, null given in /home/cymethod/domains/cy0method.org/public_html/navigation/last_5_clicks.php on line 157
Warning: mysqli_fetch_array() expects parameter 1 to be mysqli_result, null given in /home/cymethod/domains/cy0method.org/public_html/navigation/last_5_clicks.php on line 163
Warning: mysqli_close() expects parameter 1 to be mysqli, boolean given in /home/cymethod/domains/cy0method.org/public_html/navigation/last_5_clicks.php on line 174